OpenOCD
Warning
ARCHIVED PAST COMPETITION, FOR REFERENCE ONLY
OpenOCD (Open On-Chip Debugger) is an open-source program that provides control and access to the DAP (Debug Access Point) on a microcontroller. OpenOCD is used in conjunction with a debug probe. On the MAX78000FTHR development board, a debug probe is provided by a secondary MCU on the development board. This DAP is recognized as DAPLink.
Installation
Support for the MAX78000FTHR requires a custom fork of OpenOCD by Analog Devices. https://github.com/Analog-Devices-MSDK/openocd
The recommended installation method of OpenOCD for the 2024 eCTF is through the provided analog-openocd.nix package. Instructions on how to utilize this package are available at Nix. This package builds OpenOCD from source, and as such takes around 10 minutes to complete.
Utilization
OpenOCD is an extremely powerful tool for debugging the operation of your system. OpenOCD can also be utilized for flashing new programs onto your system without the use of the eCTF bootloader.
openocd -f interface/cmsis-dap.cfg -f target/max78000.cfg -c "init; reset halt; max32xxx mass_erase 0; program {program.elf} verify exit"
OpenOCD provides two main interfaces for examining the program running and hardware of the MAX78000FTHR. These interfaces are the OpenOCD command window provided over a TCP socket and a remote GDB target.
In order to use either target, an OpenOCD session must be opened. This can be done with the following command.
openocd -f interface/cmsis-dap.cfg -f target/max78000.cfg -c "init"
The resulting output should look like:
[nix-shell]$ openocd -f interface/cmsis-dap.cfg -f target/max78000.cfg -c "init; reset; halt"
Open On-Chip Debugger (PKGVERSION)  OpenOCD 0.12.0 (2023-11-22-20:46)
Licensed under GNU GPL v2
Report bugs to <processor.tools.support@analog.com>
Info : CMSIS-DAP: SWD supported
Info : CMSIS-DAP: Atomic commands supported
Info : CMSIS-DAP: Test domain timer supported
Info : CMSIS-DAP: FW Version = 2.1.0
Info : CMSIS-DAP: Serial# = 0423170203eb039a00000000000000000000000097969906
Info : CMSIS-DAP: Interface Initialised (SWD)
Info : SWCLK/TCK = 1 SWDIO/TMS = 1 TDI = 0 TDO = 0 nTRST = 0 nRESET = 1
Info : CMSIS-DAP: Interface ready
Info : clock speed 2000 kHz
Info : SWD DPIDR 0x2ba01477
Info : [max32xxx.cpu] Cortex-M4 r0p1 processor detected
Info : [max32xxx.cpu] target has 6 breakpoints, 4 watchpoints
Info : starting gdb server for max32xxx.cpu on 3333
Info : Listening on port 3333 for gdb connections
Info : SWD DPIDR 0x2ba01477
[max32xxx.cpu] halted due to debug-request, current mode: Thread
xPSR: 0x21000000 pc: 0x1000135a msp: 0x2001ffe0
Info : Listening on port 6666 for tcl connections
Info : Listening on port 4444 for telnet connections
The OpenOCD command window can be accessed with telnet. To open this session run telnet localhost 4444. The snippet below shows an example of opening the OpenOCD command window and running the reg command. The OpenOCD command window is useful for simple debugging operations such as reading back memory,
A full list of OpenOCD commands can be found at: https://openocd.org/doc-release/html/index.html.
[nix-shell:~/Documents/ectf/ectf-2024-example/application_processor/build]$ telnet localhost 4444
Trying ::1...
telnet: connect to address ::1: Connection refused
Trying 127.0.0.1...
Connected to localhost.
Escape character is '^]'.
Open On-Chip Debugger
> reg
===== arm v7m registers
(0) r0 (/32): 0x0048e4ff
(1) r1 (/32): 0xe000e000
(2) r2 (/32): 0x0048e4ff
(3) r3 (/32): 0x00ab8298
(4) r4 (/32): 0x20000004
(5) r5 (/32): 0x00000000
(6) r6 (/32): 0x00000000
(7) r7 (/32): 0x00000000
(8) r8 (/32): 0x00000000
(9) r9 (/32): 0x00000000
(10) r10 (/32): 0x00000000
(11) r11 (/32): 0x00000000
(12) r12 (/32): 0xf4240000
(13) sp (/32): 0x2001ffe0
(14) lr (/32): 0x10001209
(15) pc (/32): 0x1000135a
(16) xPSR (/32): 0x21000000
(17) msp (/32): 0x2001ffe0
(18) psp (/32): 0x00000000
(20) primask (/1): 0x00
(21) basepri (/8): 0x00
(22) faultmask (/1): 0x00
(23) control (/3): 0x00
(42) d0 (/64): 0x0000000000000000
(43) d1 (/64): 0x0000000000000000
(44) d2 (/64): 0x0000000000000000
(45) d3 (/64): 0x0000000000000000
(46) d4 (/64): 0x0000000000000000
(47) d5 (/64): 0x0000000000000000
(48) d6 (/64): 0x0000000000000000
(49) d7 (/64): 0x0000000000000000
(50) d8 (/64): 0x0000000000000000
(51) d9 (/64): 0x0000000000000000
(52) d10 (/64): 0x0000000000000000
(53) d11 (/64): 0x0000000000000000
(54) d12 (/64): 0x0000000000000000
(55) d13 (/64): 0x0000000000000000
(56) d14 (/64): 0x0000000000000000
(57) d15 (/64): 0x0000000000000000
(58) fpscr (/32): 0x00000000
===== Cortex-M DWT registers
GDB (GNU Project Debugger) is a utility that can be used for debugging running programs. GDB can be utilized for both embedded programs and Linux applications. Inside of the Nix environment, arm-none-eabi-gdb is preinstalled. This is a specific version of GDB that support the ARM architecture used on the MAX78000FTHR develompent board. GDB is able to utilize OpenOCD to provide descriptive debugging of your programs.
GDB is best utilized with program symbols. Symbols tell GDB information about which line of C code you are executing, and allows you to analyze operation of your programs at a high level.
Before starting GDB ensure that you have started an OpenOCD connection. To start GDB run
[nix-shell]$ arm-none-eabi-gdb {path to elf file}
GNU gdb (Arm GNU Toolchain 12.2.Rel1 (Build arm-12.24)) 12.1.90.20221210-git
Copyright (C) 2022 Free Software Foundation, Inc.
License GPLv3+: GNU GPL version 3 or later <http://gnu.org/licenses/gpl.html>
This is free software: you are free to change and redistribute it.
There is NO WARRANTY, to the extent permitted by law.
Type "show copying" and "show warranty" for details.
This GDB was configured as "--host=x86_64-apple-darwin19.6.0 --target=arm-none-eabi".
Type "show configuration" for configuration details.
For bug reporting instructions, please see:
<https://bugs.linaro.org/>.
Find the GDB manual and other documentation resources online at:
    <http://www.gnu.org/software/gdb/documentation/>.

For help, type "help".
Type "apropos word" to search for commands related to "word"...
Reading symbols from /Users/fstine/Downloads/led_rainbow.elf...
(gdb)
[nix-shell:~/Documents/ectf/ectf-2024-example]$ arm-none-eabi-gdb ~/Downloads/led_rainbow.elf
GNU gdb (Arm GNU Toolchain 12.2.Rel1 (Build arm-12.24)) 12.1.90.20221210-git
Copyright (C) 2022 Free Software Foundation, Inc.
License GPLv3+: GNU GPL version 3 or later <http://gnu.org/licenses/gpl.html>
This is free software: you are free to change and redistribute it.
There is NO WARRANTY, to the extent permitted by law.
Type "show copying" and "show warranty" for details.
This GDB was configured as "--host=x86_64-apple-darwin19.6.0 --target=arm-none-eabi".
Type "show configuration" for configuration details.
For bug reporting instructions, please see:
<https://bugs.linaro.org/>.
Find the GDB manual and other documentation resources online at:
    <http://www.gnu.org/software/gdb/documentation/>.

For help, type "help".
Type "apropos word" to search for commands related to "word"...
Reading symbols from /Users/fstine/Downloads/led_rainbow.elf...
(gdb)
Once you are at this point, GDB has loaded the symbols from your program, but if not yet connected to the OpenOCD session. To connect, use the command tar ext :3333.
(gdb) tar ext :3333
Remote debugging using :3333
0x100008cc in MXC_Delay (us=us@entry=200000) at /Users/fstine/Documents/ectf/ectf-2024-example/msdk/Libraries/CMSIS/../PeriphDrivers/Source/SYS/mxc_delay.c:245
245     while (SysTick->VAL > endtick) {}
(gdb)
Now you are good to go with GDB! GDB has lots of commands that you can utilize to control your programs operation. A good reference for GDB is: https://users.ece.utexas.edu/~adnan/gdb-refcard.pdf.
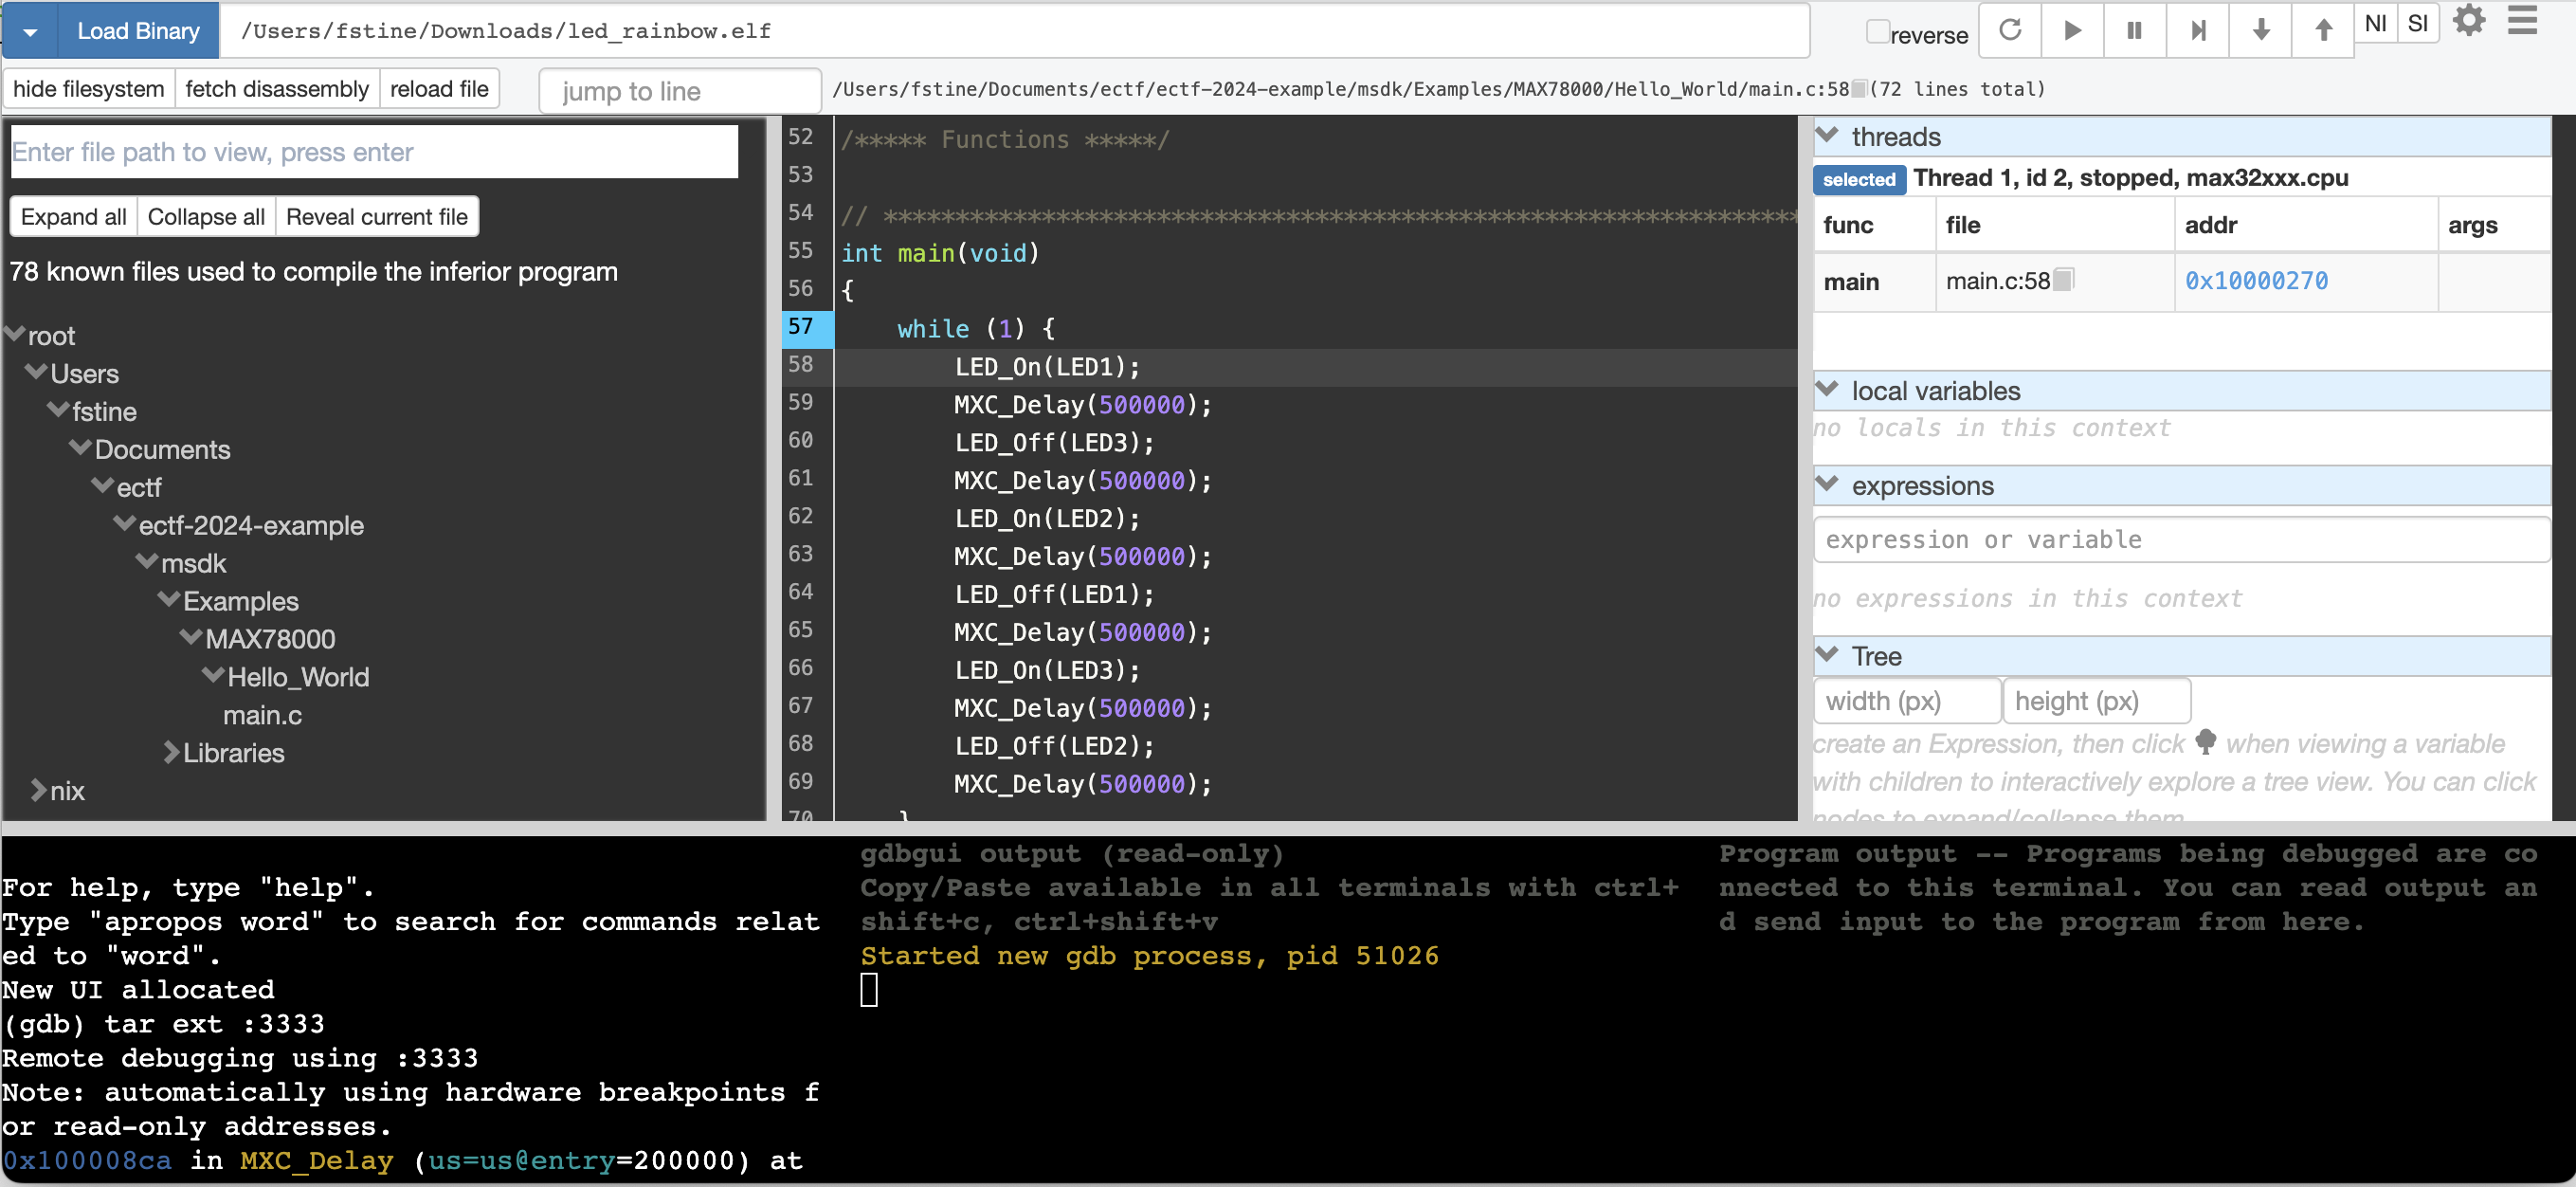
If you have debugged embedded systems in the past, you may be more familiar with a GUI (Graphical User Interface) for GDB. GDBGUI An open-source browser based GUI for GDB and can be installed with Poetry with poetry add gdbgui. To use GDBGUI, skip the sections on utilizing GDB above, and after initializing the OpenOCD connection run the command below from the Nix environment.
poetry gdbgui --gdb $(which arm-none-eabi-gdb) {path to elf file}
Once initialized, you still need to attach GDB to the OpenOCD session. This can be done with the same tar ext :3333 command. This command should be entered in the bottom left window of GDBGUI. At this point you are good to debug with GDBGUI. You can set breakpoints, step through your code, examine memory, and registers!